Dynamic View:

10/20/2011

Google地圖 - 你可以到達多遠的地方? / How far can you get with Google Maps?

Isochrone 地圖可讓你設定在一個時間內從某地點以何種交通工具(開車、單車、步行)的條件下,告訴你可以到達多遠的地方?

ex: From Taipei 101 on foot in 20 min.

Isochrone maps show you how far you can travel from a given location in a set time. The Isochronous Application uses Google Maps to help you work out how far you can travel from any location in any amount of time.

The application allows users to select a location, a time and the mode of transport (car, on foot or by bike). The map then displays a polygon on the map showing where you could travel in the defined time.

Also See

  • Walk Score - how far you can travel on foot in a given time
  • Create an Isochrone Map - a tutorial on how to create your own isochrone map with Google Maps
  • Mapnificent - how far you can travel with public transport in a given time
via:  How far can you get with Google Maps?

10/18/2011

日本輻射地圖 / Japanese Radiation Levels on Google Maps

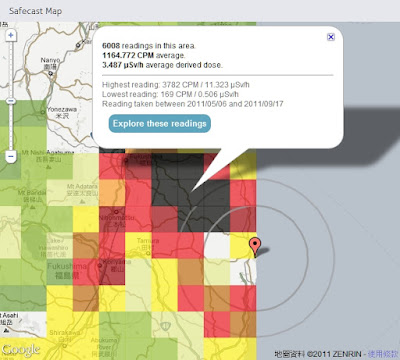
Safecast 於日本311強震後一週即建立起靜態及移動式監測網,目前已自政府及其他來源收集超過75萬點位監測資料並呈現在Google 地圖上,提供局部均值方塊圖(點擊Explore these readings 可看到詳細點位資料)及監測收集路線上所有點位輻射值並以顏色來區分不同強度。

Safecast was created one week after this year's Japanese earthquake in order to build a radiation sensor network of static and mobile sensors around Japan. So far Safecast has collected over 750,000 data points which they have made accessible through a number of useful Google Maps. The Safecast Map depicts a heat map of the radiation readings. It is possible to select individual squares on the map and view the average readings. Safecast have been driving across Japan in order to take radiation level readings. The data form each trip can be viewed on its own Google Map. The Safecast trips maps can be searched by location. In addition Safecast are aggregating radiation data from government and other sources. This data can be viewed on the Aggregate Map From All Sources.


Satellite Photos of Japan, Before and After the Quake and Tsunami by New York Times

Japan Earthquake: before and after by ABC News


2011年日本地震分佈圖  Japan earthquakes 2011 Visualization map


放射線モニタリング情報
Monitoring information of environmental radioactivity level

リアルタイム線量測定システム


via: Japanese Radiation Levels on Google Maps, Safecast, Satellite Photos of Japan, Before and After the Quake and Tsunami, Japan Earthquake: before and after, 日本各縣輻射量地圖 日本災前後衛星對比圖, 2011年の日本の地震 分布図

10/17/2011

泰國洪水災害地圖 / Google Crisis Response - Thailand Floods 2011


Thailand Floods 2011

泰國遭遇50年來最大洪水災害。超過三分之二的國土都被淹沒,淹沒了稻田及關閉上百家工廠,而超過90萬家庭和企業都受到影響,並已有數百人不幸喪生。泰國救災工作目前集中在提供流離失所者必要的食品、清潔水和棲身之所和恢復受損的基礎設施。Google Crisis Response 設立泰國洪災地圖網站,提供緊急聯絡資訊並於地圖上顯示相關災害範圍、地點及避難所、捐助等資訊以利防救災。

Thailand is currently facing its worst flooding in 50 years. Flood waters have swamped more than two-thirds of the country, submerging rice fields and shutting down hundreds of factories while over 900,000 families and businesses have been impacted and hundreds of lives have been tragically lost. National relief efforts are now focused on providing essential food, clean water and shelter to displaced people and restoring damaged infrastructure to the Kingdom of Smiles.


圖層 Layers:
Severely affected area: Urgent help needed
Flooding Extents
Satellite imagery
Bangkok risk areas and water barriers
Shelters
Parking Areas
Donations
Flood affected areas across Thailand
Flooded Highways Map
more ......

GeoEye Satellite imagery - Google Crisis Response
Flood affected areas+Risk areas+Flood Extents
Thailand Floods 2011 - Google Crisis Response


Thailand Flood Map by ESRI


USEFUL LINKS: