
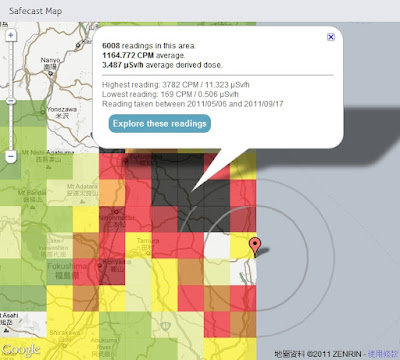
Safecast was created one week after this year's Japanese earthquake in order to build a radiation sensor network of static and mobile sensors around Japan. So far Safecast has collected over 750,000 data points which they have made accessible through a number of useful Google Maps. The Safecast Map depicts a heat map of the radiation readings. It is possible to select individual squares on the map and view the average readings. Safecast have been driving across Japan in order to take radiation level readings. The data form each trip can be viewed on its own Google Map. The Safecast trips maps can be searched by location. In addition Safecast are aggregating radiation data from government and other sources. This data can be viewed on the Aggregate Map From All Sources.


 |
| Satellite Photos of Japan, Before and After the Quake and Tsunami by New York Times |
 |
Japan Earthquake: before and after by ABC News |
2011年日本地震分佈圖 Japan earthquakes 2011 Visualization map
 |
| 放射線モニタリング情報 Monitoring information of environmental radioactivity level リアルタイム線量測定システム |
via: Japanese Radiation Levels on Google Maps, Safecast, Satellite Photos of Japan, Before and After the Quake and Tsunami, Japan Earthquake: before and after, 日本各縣輻射量地圖 日本災前後衛星對比圖, 2011年の日本の地震 分布図

