Dynamic View:
顯示具有 衛星 標籤的文章。 顯示所有文章

10/26/2011

土耳其7.2級強震 / Powerful earthquake strikes Turkey

土耳其東南部與伊朗接壤的凡城省23日發生黎克特制7.2級強震,此次地震為土耳其12年來最強,震源深度僅10公里,屬淺層地震。土耳其位於歐亞板塊震帶,此地震帶近年地殼運動甚為活躍。地震發生於當地時間23日13時41分,震央位於塔班里村(Tabanli),靠近伊朗邊境。
美國地質調查局稱,地震震級為7.3級。當天晚些時候,土耳其方面將震級更正為7.2級。
除了與時間賽跑,營救受困人員外,當局目前最大的隱憂是,由於凡城位於土耳其第一大湖「凡湖」東岸,一旦大地震導致凡湖移位,大量湖水恐將灌入鄰近區域,使災情更加一發不可收拾。
土耳其位於歐亞板塊地震帶,是全球三大地震帶之一。地震主因是印度洋在印尼地區隱沒,印度半島向北與亞洲大陸發生碰撞,以及非洲大陸與歐亞大陸碰撞所造成。


The U.S. Geological Survey initially reported the quake had a magnitude of 7.3, then revised it down to 7.2.
Turkey is a tectonically active country that experiences frequent destructive earthquakes. On a broad scale, the seismtectonics of the region near the October 23, 2011 earthquake are controlled by the collision of the Arabian Plate and Eurasian plates; at the latitude of this event, the Arabian plate converges with Eurasia in a northerly direction at a rate of approximately 24 mm/yr. West of the October 23, 2011, earthquake tectonics are dominated by strike-slip faulting on the East (in southern Turkey) and North (in northern Turkey) Anatolian fault zones. These large, translational fault systems extend across much of central and western Turkey and accommodate the western motion of the Anatolian block as it is being squeezed by the converging Arabian and Eurasian plates.

Read also: Understanding the 7.2 magnitude earthquake in East Turkey (October 23, 2011)

Read also : New Insights into the October 2011 Van (Turkey) Earthquake – detailed analysis by the CEDIM Forensic Earthquake Analysis Group


Google Crisis Response : 2011 Turkey Eathquake, include Person Finder, Resources, Important Telephone Numbers, Maps and satellite imagery, News and Updates.

社群媒體地圖 / ESRI Social Media Map

Turkey Quake Map: Click to see animation

Click to see more Photos: Powerful earthquake strikes Turkey
7.2 Earthquake In Eastern Turkey 10-23-2011

CCTV shows moment when earthquake

Aerial of earthquake-hit Turkey shows full extent of damage

via: Earthquake-report, 星島日報

10/20/2011

德國衛星ROSAT將墜落地球 / German scientists say 3-tonne satellite will fall to Earth 'from Friday this week'


上月底失控墜入地球的美國「高層大氣研究衛星」(UARS)引起一場虛驚,現在又有德國「侖琴衛星」(ROSAT)將於本月廿一日到廿五日之間,在失控狀態中重返大氣層,最有可能是廿二或廿三日墜落,但確切的時間和落點目前仍無法判定。
     總重二.四公噸的侖琴是X射線太空觀測衛星,預料會在重返地球大氣層時解體,約一.七公噸的殘骸可能通過高熱的考驗墜落地表,包括近卅個耐高熱的觀測鏡片和陶瓷組件。
     德國太空總署指出,侖琴衛星殘骸造成傷害的機率大約是二千分之一,略高於UARS的三千二百分之一,但地球人口約七十億,所以任何人「中獎」的機率為十四兆分之一。UARS在九月廿四日墜入南太平洋杳無人跡的海域。
     侖琴衛星的軌道從北緯五十三度延伸到南緯五十三度,這意味殘骸可能墜落在加拿大到南美洲之間的任何地點,確切時間和落點大約要到殘骸衝擊地表前兩小時才能判定。

點擊圖片可即時看到 ROSAT 衛星目前預測軌道位置。
German scientists say 3-tonne satellite will fall to Earth 'from Friday this week'
  • Fragments 'could hit in 50-mile-wide track' along path
  • Could hit anywhere from 53 degrees north and 53 south - including U.S. and UK
  • 1 in 2000 chance it will hit someone
  • Satellite will hit between October 21st and 24th

From Friday this week a three-tonne satellite is set to fall to Earth, the German Aerospace Agency DLR warned today.

The ROSAT satellite will re-enter between October 21st and 24th, scientists predict, and could strike anywhere on Earth between 53 degrees north and 53 degrees south - an area stretching from as far north as the UK to as far south as the Falkland Islands.

The agency calculates that there is a 1 in 2000 chance it will hit someone. 

Fragments - including pieces of a heat-resistant mirror weighing 880lb - could hit anywhere within an 50 mile-wide path along the satellite's track.

10/18/2011

日本輻射地圖 / Japanese Radiation Levels on Google Maps

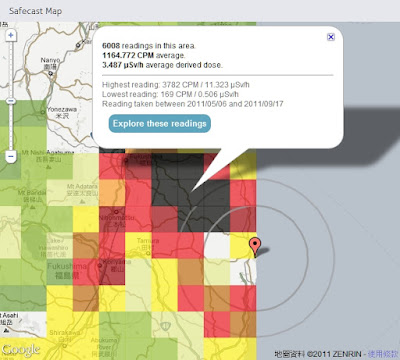
Safecast 於日本311強震後一週即建立起靜態及移動式監測網,目前已自政府及其他來源收集超過75萬點位監測資料並呈現在Google 地圖上,提供局部均值方塊圖(點擊Explore these readings 可看到詳細點位資料)及監測收集路線上所有點位輻射值並以顏色來區分不同強度。

Safecast was created one week after this year's Japanese earthquake in order to build a radiation sensor network of static and mobile sensors around Japan. So far Safecast has collected over 750,000 data points which they have made accessible through a number of useful Google Maps. The Safecast Map depicts a heat map of the radiation readings. It is possible to select individual squares on the map and view the average readings. Safecast have been driving across Japan in order to take radiation level readings. The data form each trip can be viewed on its own Google Map. The Safecast trips maps can be searched by location. In addition Safecast are aggregating radiation data from government and other sources. This data can be viewed on the Aggregate Map From All Sources.


Satellite Photos of Japan, Before and After the Quake and Tsunami by New York Times

Japan Earthquake: before and after by ABC News


2011年日本地震分佈圖  Japan earthquakes 2011 Visualization map


放射線モニタリング情報
Monitoring information of environmental radioactivity level

リアルタイム線量測定システム


via: Japanese Radiation Levels on Google Maps, Safecast, Satellite Photos of Japan, Before and After the Quake and Tsunami, Japan Earthquake: before and after, 日本各縣輻射量地圖 日本災前後衛星對比圖, 2011年の日本の地震 分布図