Dynamic View:

5/11/2013

Sea Level Rise and Coastal Flooding Impacts / NOAA 海岸淹水潛勢模擬地圖


The purpose of this data viewer is to provide coastal managers and scientists with a preliminary look at sea level rise and coastal flooding impacts. The viewer is a screening-level tool that uses nationally consistent data sets and analyses.  Data and maps provided can be used at several scales to help gauge trends and prioritize actions for different scenarios.  

  • Displays potential future sea levels
  • Provides simulations of sea level rise at local landmarks
  • Communicates the spatial uncertainty of mapped sea levels
  • Models potential marsh migration due to sea level rise
  • Overlays social and economic data onto potential sea level rise
  • Examines how tidal flooding will become more frequent with sea level rise


 Additional documents and links provide further detail.

Sea Level Rise and Coastal Flooding Impacts http://www.csc.noaa.gov/slr/viewer/#

Google Map/Earth觀察報@Sinica » 美國國家海洋暨大氣總署(NOAA)海岸淹水潛勢模擬地圖 http://lnkd.in/6GkwJj 


8/11/2012

菲律賓洪水災害地圖 / Philippines Flood Map

Resources related to the 2012 Philippines flood

On Monday, 6 August 2012 a Southwest Monsoon brought by Tropical Storm Haiku hit the Island of Luzon, Philippines and brought 24 hours of torrential rains that triggered disastrous flooding. NCR, Region I, III and IV-A are worst hit, with more than 800,000 persons affected. More than 250,000 people are in evacuation centers. Source: National Disaster Risk Reduction and Management Council.

Google Crisis Response

Philippine Flood hazard maps


Flood hazard maps


Reference: 

Monsoon rains swamp Philippine capital, markets shut | Reuters 


6/21/2012

菲律賓洪水災害預警地圖 / The Philippines Flood Hazard Map


Project Noah is a new Google Maps based flood hazard warning map from the Philippines' National Operational Assessment of Hazards and Risks (NOAH).

The map includes a number of weather layers. It is possible to view an animated radar layer from MTSAT. It is also possible to get the latest stream and rain gauge readings from across the country. If you want to know the current weather in the Philippines you can also select to view the Weather Outlook layer on the map.


Noah 計畫是一個建構在 Google Maps 的洪水災害預警地圖系統,包括很多圖層及目前天候。如下圖

Probability of Rain

Flood MAP

Pressure / Rainfall Contour

MTSAT
Weather Station

Rainfall

Temperature

Water Level

Doppler

Source: The Philippines Flood Hazard Map by Keir ClarkeNoah

6/02/2012

被災地の上空写真を一刻も早く人々の手に(1) – 東日本大震災と情報、インターネット、Google

東日本大震災と情報、インターネット、Google

被災地の上空写真を一刻も早く人々の手に(1)


震災直後、被災地に家族や知人のいる人々は、焦燥に駆られた。津波はどこまで及んだのか? 家は流されていないか? Google は、人工衛星からの写真を提供することで人々の不安を少しでも和らげようとした。
2012 年 6 月 1 日掲載

衛星写真に記録された仙台空港の復興


Google Earth を起動し、時計のマークをクリックすると時間を巻き戻せるスライダが現れる。


Google Earth で最新状況を伝える

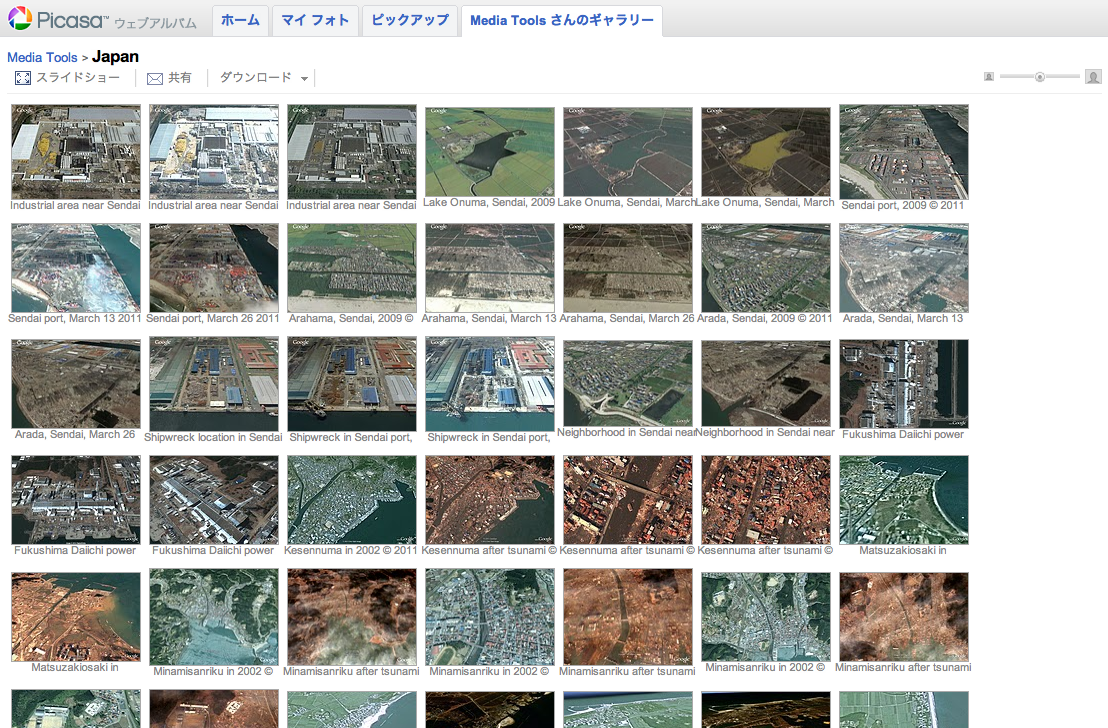
Picasa ウェブアルバム上で公開された衛星写真。


Google マップのマイマップから衛星写真を呼び出す

河合は Google マップのマイマップ機能を使って地図から該当する衛星写真を呼び出せるようにした。


Read More 続きを読む >> 被災地の上空写真を一刻も早く人々の手に(1) – 東日本大震災と情報、インターネット、Google


5/02/2012

空中街景(環景) / Aerial Street View (Panorama)


非Google官方街景 / Unofficial Google Street View
點擊影像觀看 / Click images to view

Panoramic Aerial Photography worldwide , Tours From Above

New York City Aerial virtual tour designed by John Colebrook - Pixelcase

Google Map • 360° Aerial Panorama, Airpano
Aerial Virtual Tours, VR Web Design
,Panoramic World, 360Cities

4/14/2012

利用航空照片尋找炸彈 / German Firm Uses Aerial Photos to Find Bombs


A small German firm offers a unique service to the country's construction industry: It uses historical British and American aerial photography from World War II air strikes to determine the location of unexploded bombs. Thousands of tons of bombs still lie in the soil and the duds are becoming more dangerous.


The photos usually show a "before" and "after" view of a raid, with images taken just days or weeks apart. Where wartime analysts used machines called stereoscopes to look at the images in 3-D, Luftbilddatenbank technicians use digital software. They can then spot craters -- an indication that a bomb exploded -- and dark pinpoint holes, which suggest a dud that might still be buried under the surface.


一家德國小公司提供建築行業獨特的服務:使用從二次世界大戰空襲時期,英國和美國的歷史航空照片,以確定未爆炸的炸彈的位置。戰後數十年仍躺在土壤底下成千上萬噸的炸彈和未爆彈變得愈加危險。

利用襲擊前後相差數天(週)同地區不同時間拍的航片,組成立體像對 。戰時分析師使用橋式立體鏡,Luftbilddatenbank 技術人員則使用軟體以3D立體方式觀察 ,可判讀炸彈爆炸後的跡象(類似隕石坑 ) 和黑孔,這表示可能有啞彈仍埋在地表下。

Read more 更多 >>

Photo Gallery: Finding the Explosive Needle in the Haystack

3/13/2012

日本311賑災捐款地圖 / Japan AID Map - See Where AID Went


JAPAN EARTHQUAKE AND TSUNAMI RELIEF

100% of all contributions received have been used exclusively to help people in Japan, supporting local Japanese organizations caring for the most vulnerable people affected by the earthquake and tsunami, with special focus on people with disabilities and the elderly.

  • $6 million from thousands of generous donors worldwide
  • $3.98 million in grants (66% of total funds raised) to 9 Japanese relief and recovery groups
  • 4% of total funds raised spent on program management and oversight
  • $1.8 million (30% of total funds raised) earmarked to support the long-term needs of the most vulnerable people 

THE EVENT  

On March 11, 2011, a magnitude-9.0 earthquake and subsequent tsunami and nuclear disaster struck northern Japan, killing over 16,000 people and leaving at least 3,000 missing. More than 5,400 people were injured and over 34,000 people were evacuated. The earthquake and tsunami damaged or destroyed more than 900,000 buildings. 

THE PARTNERSHIP  

Immediately following the disaster, Direct Relief and the Japanese American Citizen’s League (JACL) established the Japan Relief and Recovery Fund, committing 100% of all contributions to be used exclusively to help people in Japan in the most productive, efficient manner possible.


Read more >>

Here's where the aid went. (Interactive map)


日本地震和海嘯賑災

100% 收到的所有捐款已專款專用於幫助日本民眾,日本當地組織以關心受到地震和海嘯影響最脆弱者,尤其是殘疾和老人。

  • 世界各地 數以千計的慷慨捐助者600萬美元
  • 398萬美元的贈款(募集資金總額的66%)至9個救災和復災團體
  • 提高資金總額的4%於計畫管理和監督
  • 180萬美元(募集資金總額的30%),專門用於支持最脆弱人群的長期需求

3/07/2012

調查者的足跡:史語所民族學田野照片與標本地理資訊系統

在1920-1940年代的中國,中央研究院歷史語言研究所的研究人員,進行了大規模的民族學調查計畫。在田野調查裡,研究走訪採集各地民族的民族文物、文書與田野照片。這批彌足珍貴的民族學調查資料,對當代中國西南少數民族之民族學、歷史學和各種人文學科,均具有相當重要的研究參考價值。

史語所透過數位典藏計畫的整理與研究,將「民族文物」與「田野照片」的數位化資料結合Google Map,嘗試以地理資訊系統模擬早期民族學調查路線軌跡,並透過官方族稱、採集地點、主題類別的分類整理,關鍵字查詢,使中國西南少數民族資料庫能在圖像化的地理資訊提供檢索結果連結。

網址:調查者的足跡:史語所民族學田野照片與標本地理資訊系統
系統開發:中央研究院人社中心地理資訊科學研究專題中心

參考:史語所早期民族學調查地理資訊系統之實務應用(PDF) 


調查者的足跡:史語所民族學田野照片與標本地理資訊系統


3/01/2012

NHK「天空地圖」系統使用在311大海嘯之後 / NHK Skymap Aerial Mapping System Used After 3/11 Tsunami in Japan


NHK「天空地圖」系統使用在311大海嘯之後

去年NHK開發的「天空地圖」系統,除傳送即時空拍影像外,另傳送直升機上GPS位置、攝影機放大倍率及鏡頭方向等資料 ,結合擴增實境 (Augmented Reality, AR) 技術、透過電腦套疊地圖資料,產生如 Google Earth 標記方式,於即時影像上顯示地名、車站、建物等名稱及符號。對於如日本311大海嘯後地表面目全非,在報導、調查上很方便標示出關係位置,該技術即使在夜間也很能清楚標定。(如下圖及短片)

Read More ...

NHK Skymap Aerial Mapping System Used After 3/11 Tsunami in Japan

Skymap, developed by NHK last year, superimposes map data, such as district, station and building names on aerial pictures taken from a helicopter in real time.

NHK currently uses this system to give instructions to news helicopters, and it was used in the aftermath of the tsunami last year to guide helicopter pilots around areas left visually unidentifiable.
震災後の位置確認に活用 - 生の空撮映像に地図データを重ねるランドマーク・スーパー

NHKが昨年開発した「スカイマップ」は、ヘリコプターの空撮映像の上に、地名や駅名などのランドマーク情報をリアルタイムに表示するシステムです。

現在、地上の航空デスクがヘリコプターに指示を与える際、実際に使われています。
続きを読む


via: DigInfo TV

2/24/2012

以 Google Maps 呈現惠妮休斯顿的一生 / Whitney Houston’s journey of Life on Google Maps

Mibazaar's latest map “Whitney Houston’s journey of Life” on Google Maps. The map animates thru events in Whitney Houston’s life, from birth, school, grammy awards, super bowl appearance, concert at Norfolk Virginia for troops returning from Persian Gulf, and then her untimely death at Beverley Hills, California.

You can disable the autoplay mode by clicking on the arrows at lower left corner of the map.

Mibazaar 將惠妮休斯顿一生旅程,自出生‧求學‧獲葛萊美獎‧各地演唱直至比佛利山辭世呈現在谷歌地圖上。
左下角可控制(自動)播放。

R.I.P. Whitney Houston

Whitney Houston’s journey of Life

via: Mibazaar Blog

1/31/2012

Point Cloud Feature/Shape Extraction for AutoCAD, Civil 3D, Revit


Point Cloud Feature Extraction for AutoCAD Civil 3D Now Available

Fotolia_28471630_XS

Updated Shape Extraction for AutoCAD Now Available

Fotolia_7603707_XS

free technology preview of Point Cloud Feature Extraction for Autodesk Revit Now Available

Fotolia_11693876_XS

1/03/2012

2012跨年煙火(短片)精彩回顧 / Wonderful New Year's Eve Fireworks 2012 : Review on Google Maps


New Year's Eve Fireworks 2012


12/27/2011

菲律賓瓦西颱風災害地圖 / Google Crisis Map - Typhoon Washi (Sendong)


瓦西(Washi)颱風在當地時間16號星期五深夜,夾帶著強風豪雨,引發大量洪水和土石流,沖進菲律賓南部民答那峨島的河濱與沿岸村莊,重創該島「卡加揚德奧羅」(Cagayan de Oro)和「伊里甘」(Iligan)等地,造成嚴重傷亡,摧毀1萬多間房屋並造成30多萬人流離失所,這些民眾如今大多待在緊急避難所。
菲律賓國家減災風險管理委員會(National Disaster Risk Reduction and Management Council)負責人拉莫斯(Benito Ramos)說,遠至菲律賓中部莫好島(Bohol)的漁民,都在幫忙打撈被沖到好幾百英里外的遺體。
拉莫斯接受廣播電台訪問時說:「只要海中有遺體,搜尋與打撈作業就會持續進行,甚至新年以後也是如此。」當局已經把搜索區域擴大到半徑300公里範圍。


Washi, known locally in the Philippines as Sendong, began as a tropical depression on December 13, 2011 in the West Pacific Ocean about 2150 km (~1333 miles) due east of the southern Philippines. Washi only intensified slightly and never exceeded tropical storm intensity as it tracked due west towards the southern Philippines’ island of Mindanao.

Washi made landfall on the east coast of Mindanao on the afternoon of Dec. 16 as a moderate tropical storm with sustained winds reported at 55 knots (~63 mph). Despite its modest intensity, Washi had a huge impact on the island. As Washi made its way across Mindanao, it dumped heavy rains over parts of the island, which in turn triggered flash floods and mudslides.

Rainfall estimates from the TRMM data are shown here for the period Dec. 13 to 20, 2011 for the southern Philippines. Storm symbols mark Washi's track. Rainfall totals are on the order of 200 to over 250 mm (~8 to 10 inches, shown in green and yellow) along Mindanao's east coast where Washi made landfall, but the highest amounts are along the northwest coast, where totals are on the order of 300 to over 400 mm (~12 to over 16 inches, shown in orange and red). Credit:  SSAI/NASA, Hal Pierce

Image Credit: NASA/SSAI, Hal Pierce
NASA’s Tropical Rainfall Measuring Mission (TRMM) satellite produced the image above late on December 15, 2011. In this image, it shows the tallest thunderstorms in the storm that reached around 15 kilometers or approximately 9.3 miles. The TRMM estimated only heavy rainfall located in the southwest quadrant of the storm early on December 15. By that evening, the storm had intensified and was showing rainfall estimates of at least two inches (50 mm) per hour in the east, north, and western quadrants. Some areas across the region, including Mindanao, saw rainfall totals you would typically see in a month in just one day. Everyone pays attention to the winds of a tropical system, but the biggest threat from any tropical cyclone is heavy rain, flooding, and storm surge.

Google's Person Finder

Tagahanap ng Tao: Bagyong Sendong

Person Finder: Typhoon Sendong


Google Crisis Map - Typhoon Washi (Sendong)

NASA’s Earth Observing-1 (EO-1) satellite image : view & download

More NASA’s EO-1 satellite images

DISASTER BROUGHT BY TYPHOON WASHI (LOCALLY CALLED TYPHOON SENDONG)
Philippine flood devastation, BBC News, More Pictures ....
Typhoon Washi slams Philippines, REUTERS, More pictures .....


via: Google Crisis ResponseNASA’s Earth ObservatoryEarthSky.orgBBC NewsREUTERS, The Watchers中央廣播電臺

12/23/2011

噪音污染地圖 / Sound Pollution on Google Maps

AirCasting 用於測量室外噪音,是一個用您的智慧型手機來記錄、繪製和分享環境數據的平台。目前可上傳手機的麥克風錄得的聲級數據。不久,將納入包括分貝計(聲級計)和污染傳感器等設備到AirCasting平台上。

AirCasting is a platform for recording, mapping, and sharing environmental data using your smartphone. Currently, AirCasters can upload sound level data recorded by their phone’s microphone. AirCasting is intended for measuring outdoor noise. Soon, we’ll expand the range of devices that plug into the AirCasting platform to include sound-level meters and pollution sensors. AirCasting lets you broadcast what’s happening in your environment, crowdsource your information with that from other AirCasters, and identify patterns and commonalities.

To start recording, mapping, and sharing sound level data for your neighborhood, simply download the AirCasting app to your Android device and press play. Don’t have an Android device? Check out the AirCasting maps to see if someone has already contributed data for your area.


Air Casting Map


Free App: Android 2.1 and up